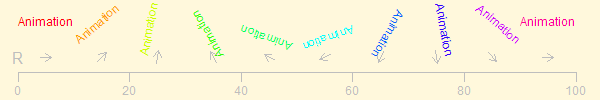
for (i in 1:360) {
    plot(1, ann = F, type = "n", axes = F)
    text(1, 1, "Animation", srt = i, col =
        rainbow(360)[i], cex = 7 * i/360)
    Sys.sleep(0.01)}
Theoretically speaking, when you know how to draw basic graphical elements such as points and lines, you can create any graphs. R has provided these elements: point, line, segment, rectangle, polygon, arrow, text, axis and title, etc. These elements can be extremely helpful to us especially when we want to customize our graphs. Click here to read a brief introduction to graphical elements.
Surely such a naive way for graphics is not convenient. We can make a histogram just by rectangles after proper computations, but the direct call of hist() will save us much time. Thus we do need high-level plots.
There are several high-level statistical plot functions in the package "graphics", and I'll introduce them in this page.
You may also think about how these plots are created via those basic elements in order to be more familiar with the R graphics system as well as the meanings of usual statistical graphics.
All of the animations in this web site are made with the help of this package "animation", and I wrote such a package just for better understanding of statistical techniques and data analysis through an interesting way.
You may download it at:
http://cran.r-project.org/web/packages/animation/l
Please note that there's a vignette for this package.