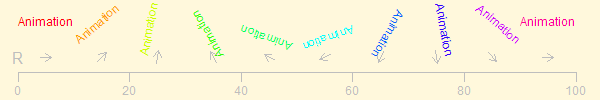
for (i in 1:360) {
    plot(1, ann = F, type = "n", axes = F)
    text(1, 1, "Animation", srt = i, col =
        rainbow(360)[i], cex = 7 * i/360)
    Sys.sleep(0.01)}
I've listed several ideas about animations. To sum up, the two main effective approaches are:
In the later part of this page, I want to collect more ideas on both animation techniques and the demonstration of statistical methods. I'm also looking forward to your contributions.
I've implemented this idea in my pages. Now you can control the speed of animations by yourself.